Basic Lighting Design Paperwork

The technical materials associated with a lighting design will vary depending on the kind of lighting job, but the goal of lighting paperwork generally remains the same: To provide clear and concise information about the designs functionality to the electricians and the production team.

Below is an example of the lighting paperwork for an opera I was lighting designer for in undergrad. The basic paperwork for theatre lighting consists of:

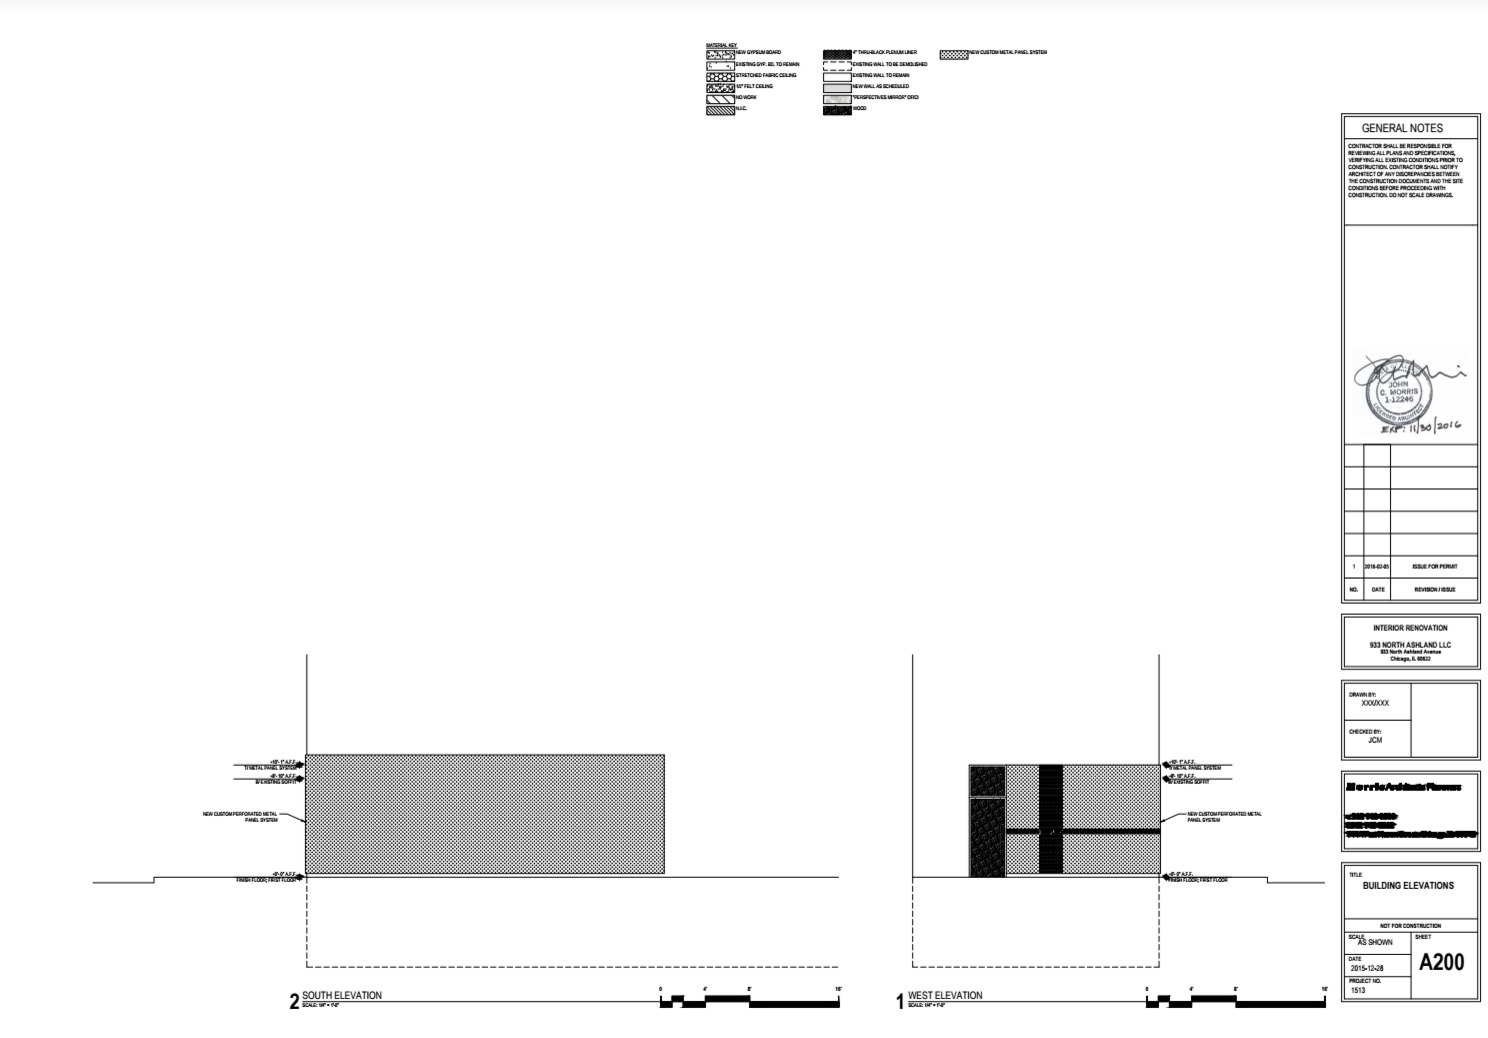
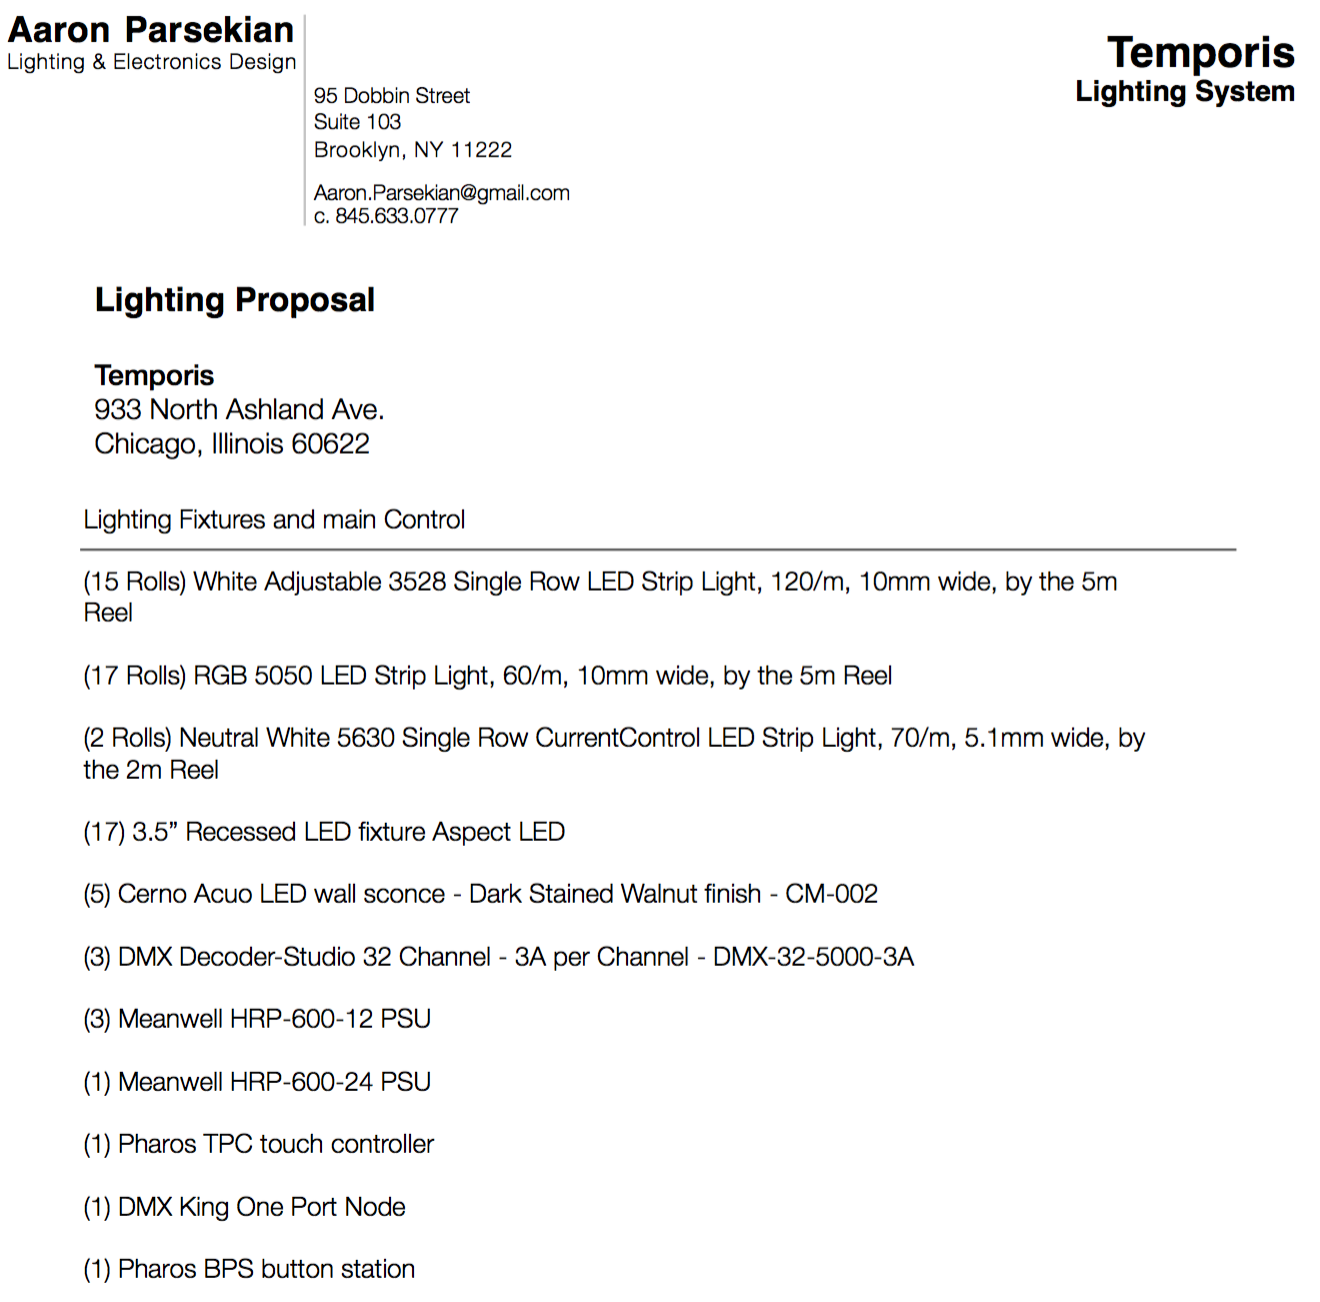
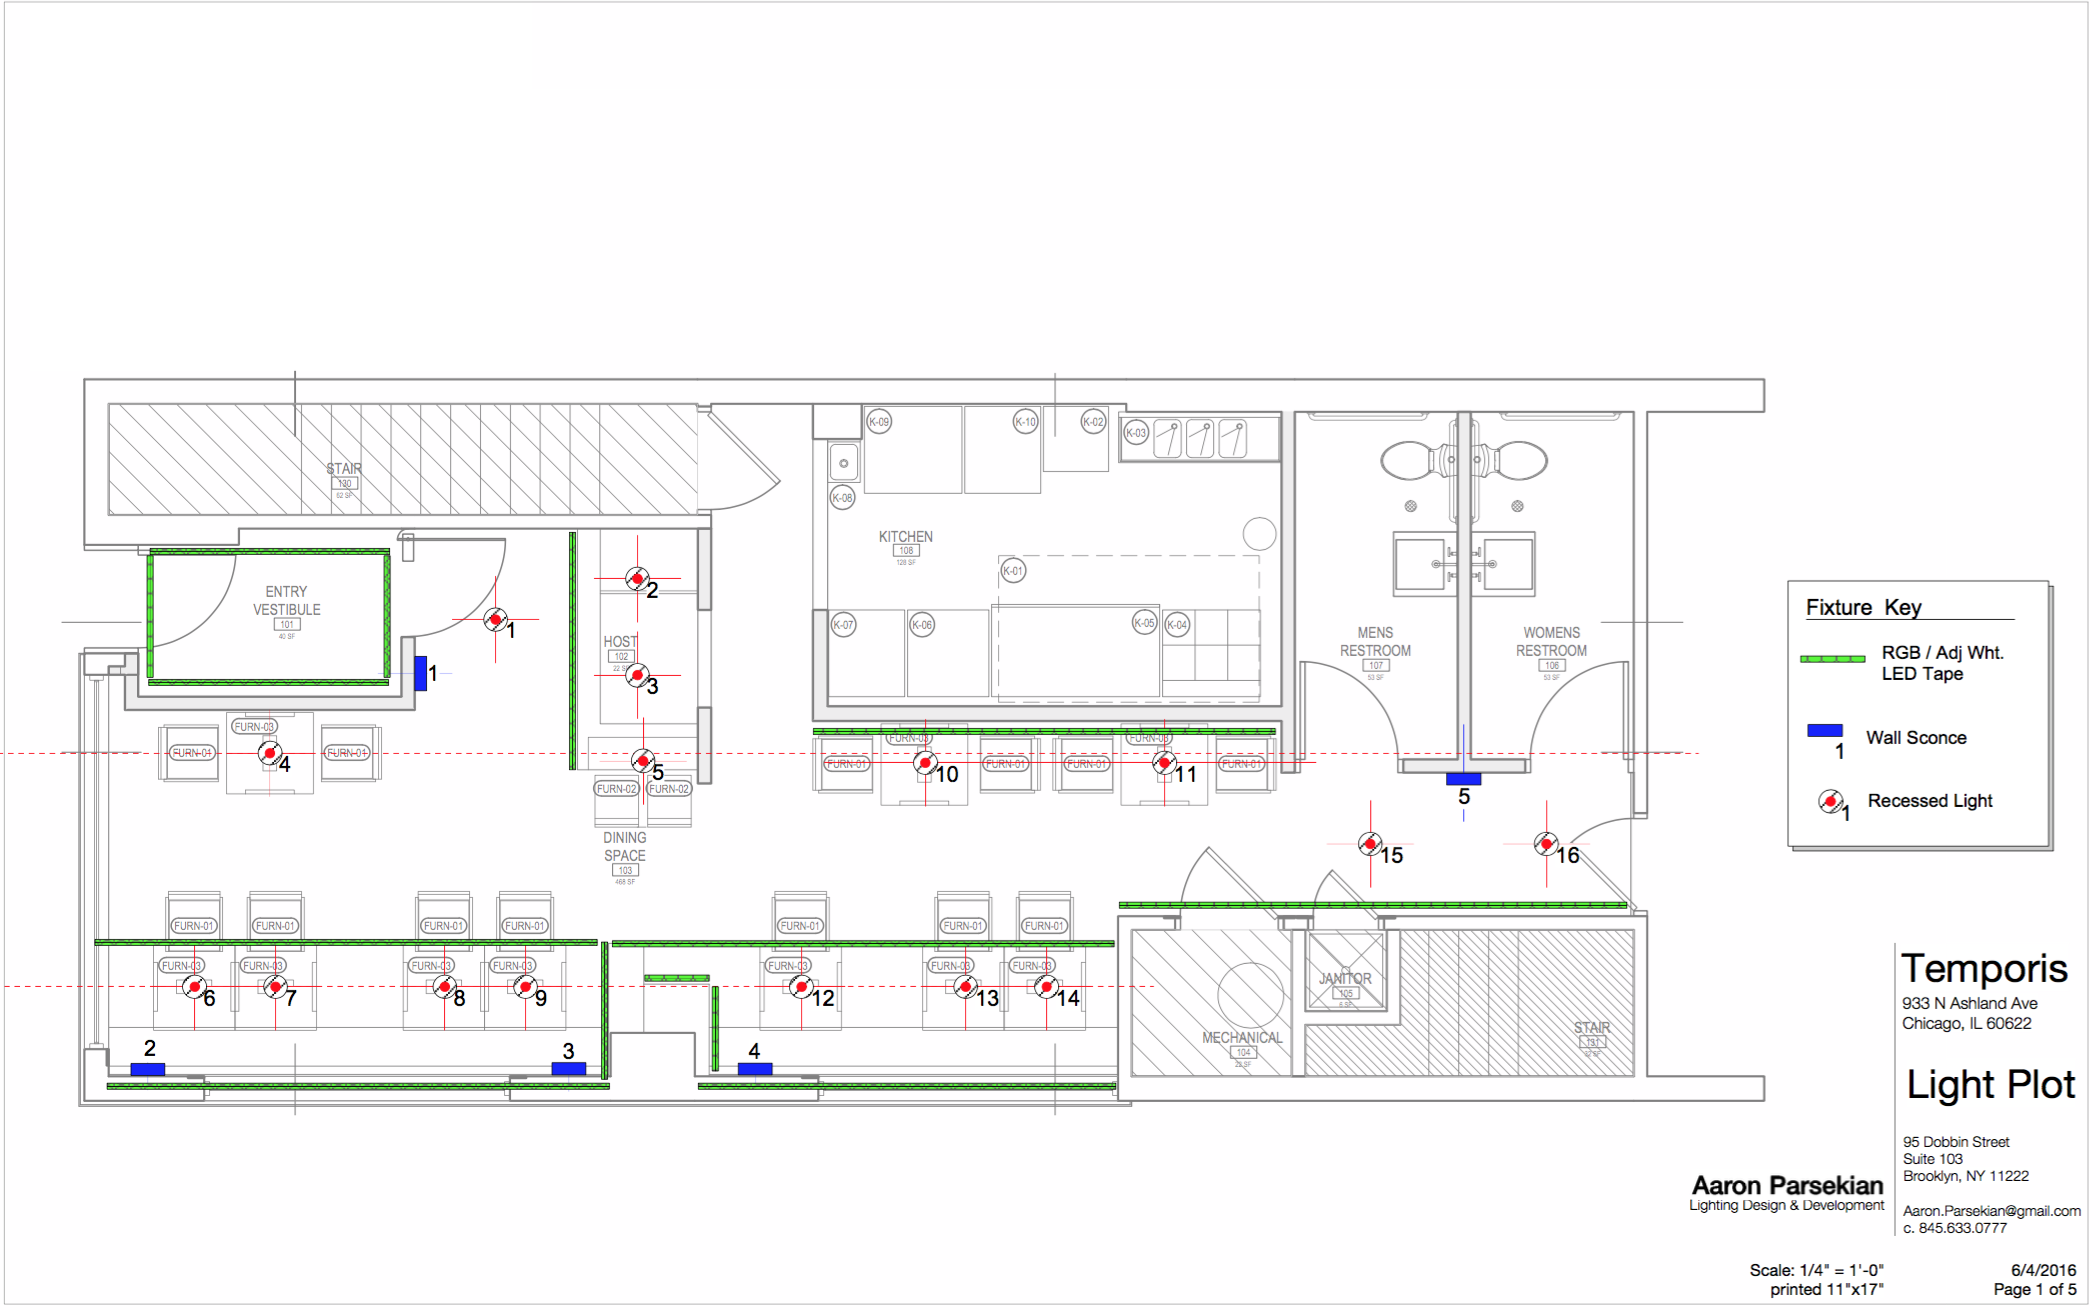
  • A Light Plot in plan view
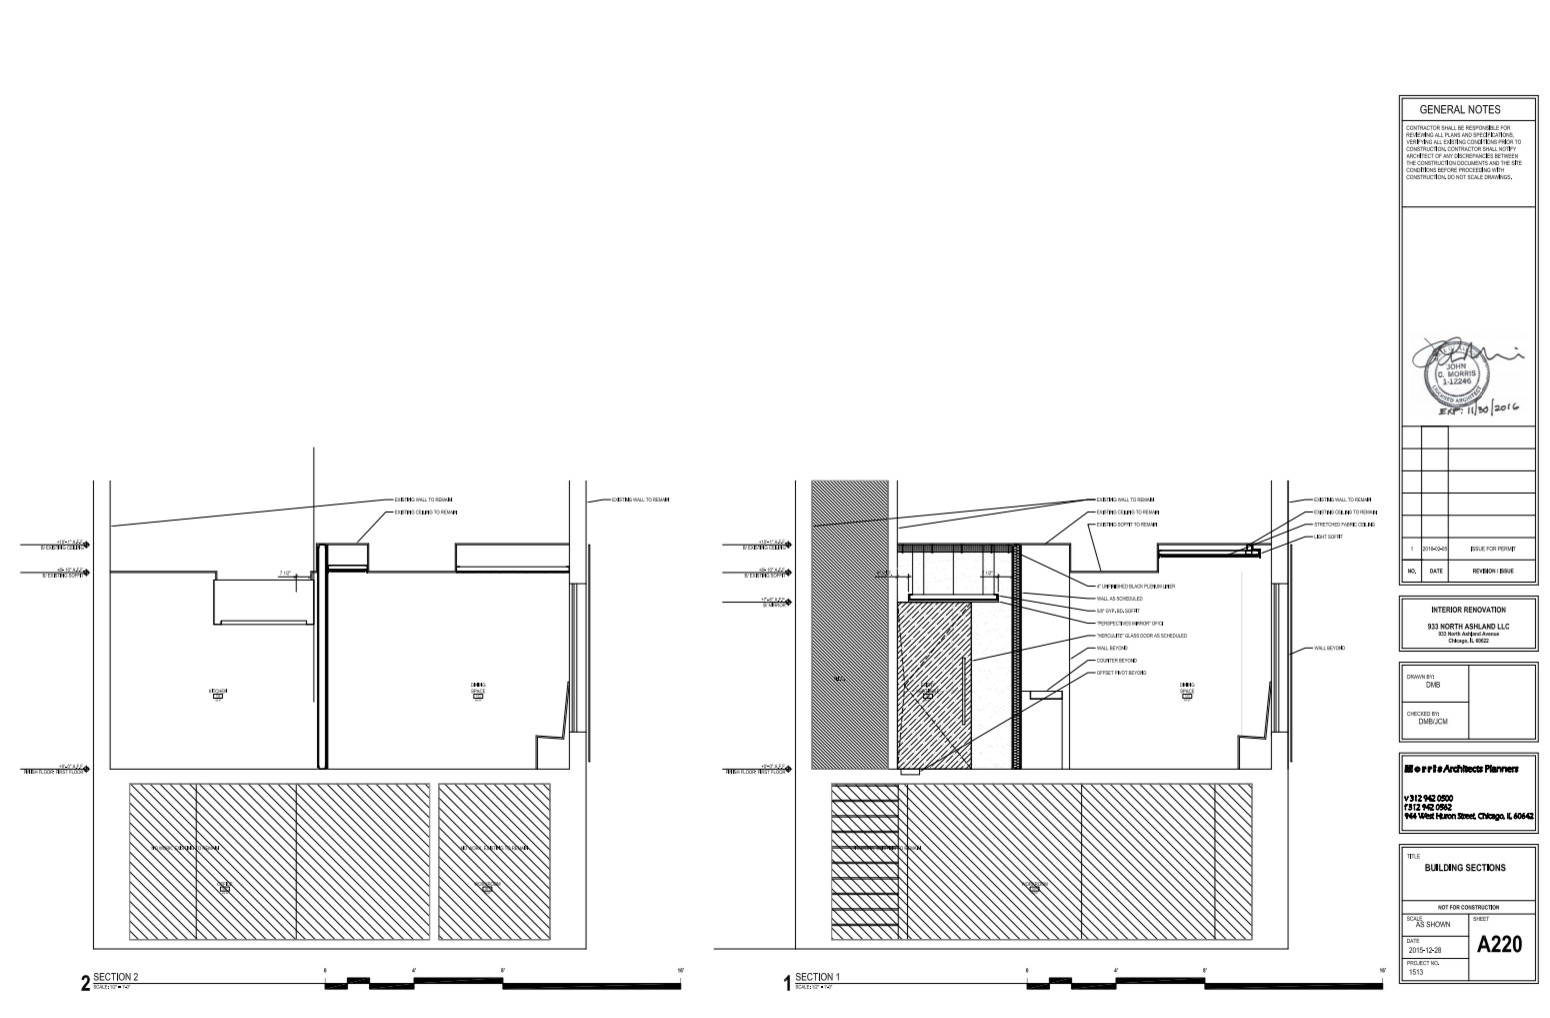
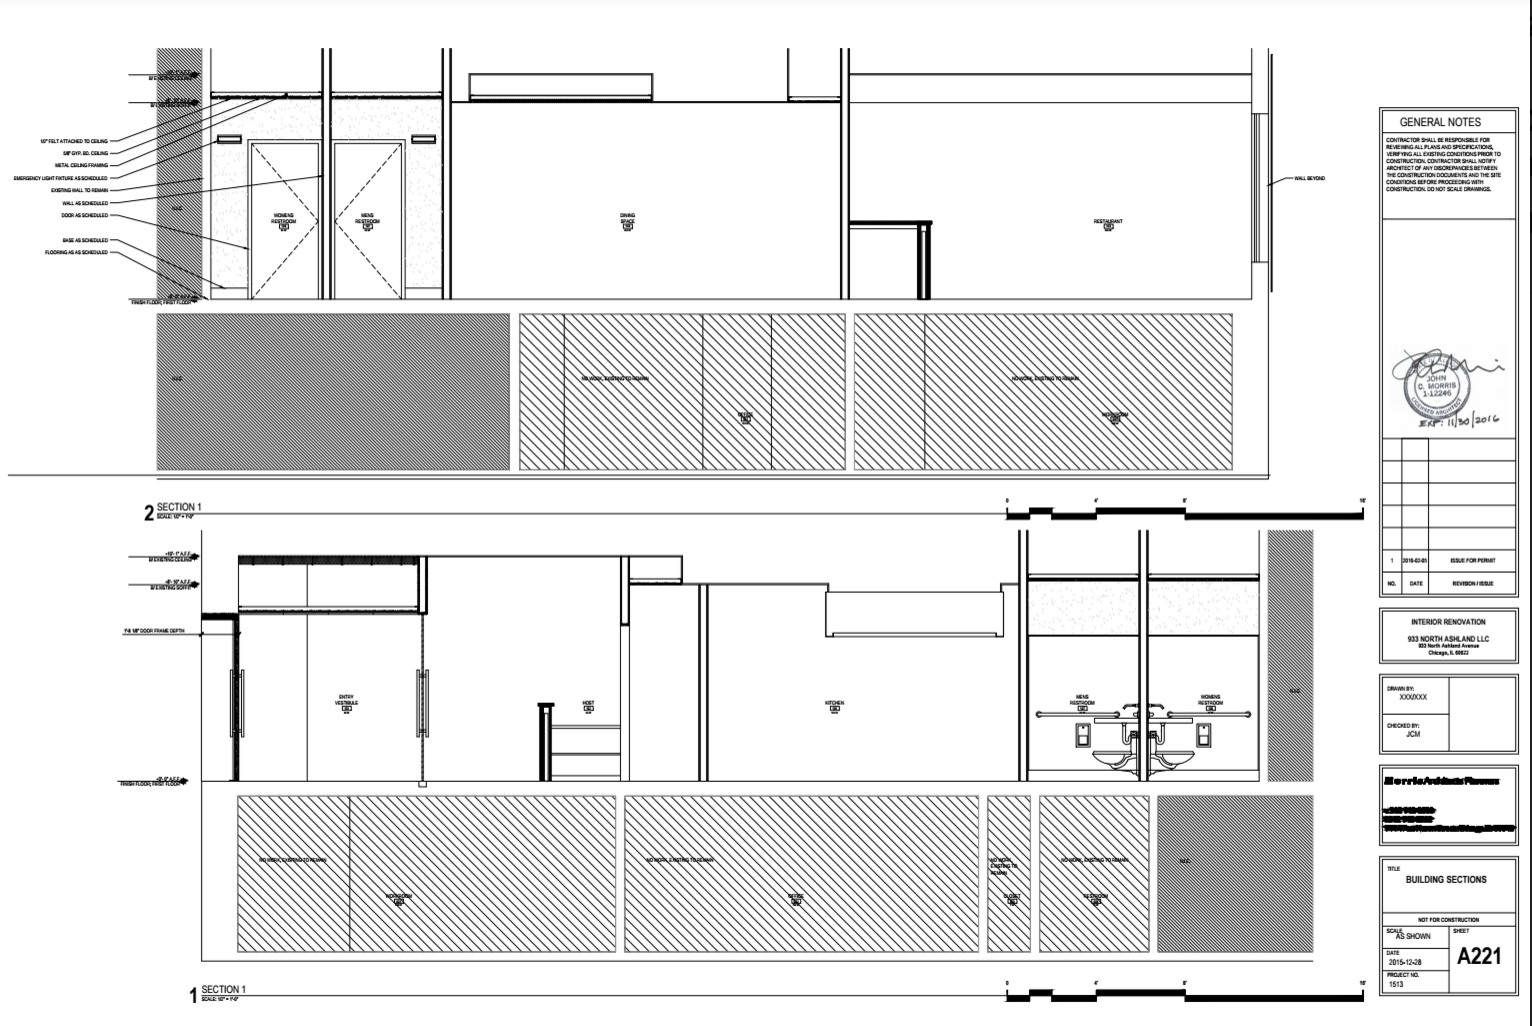
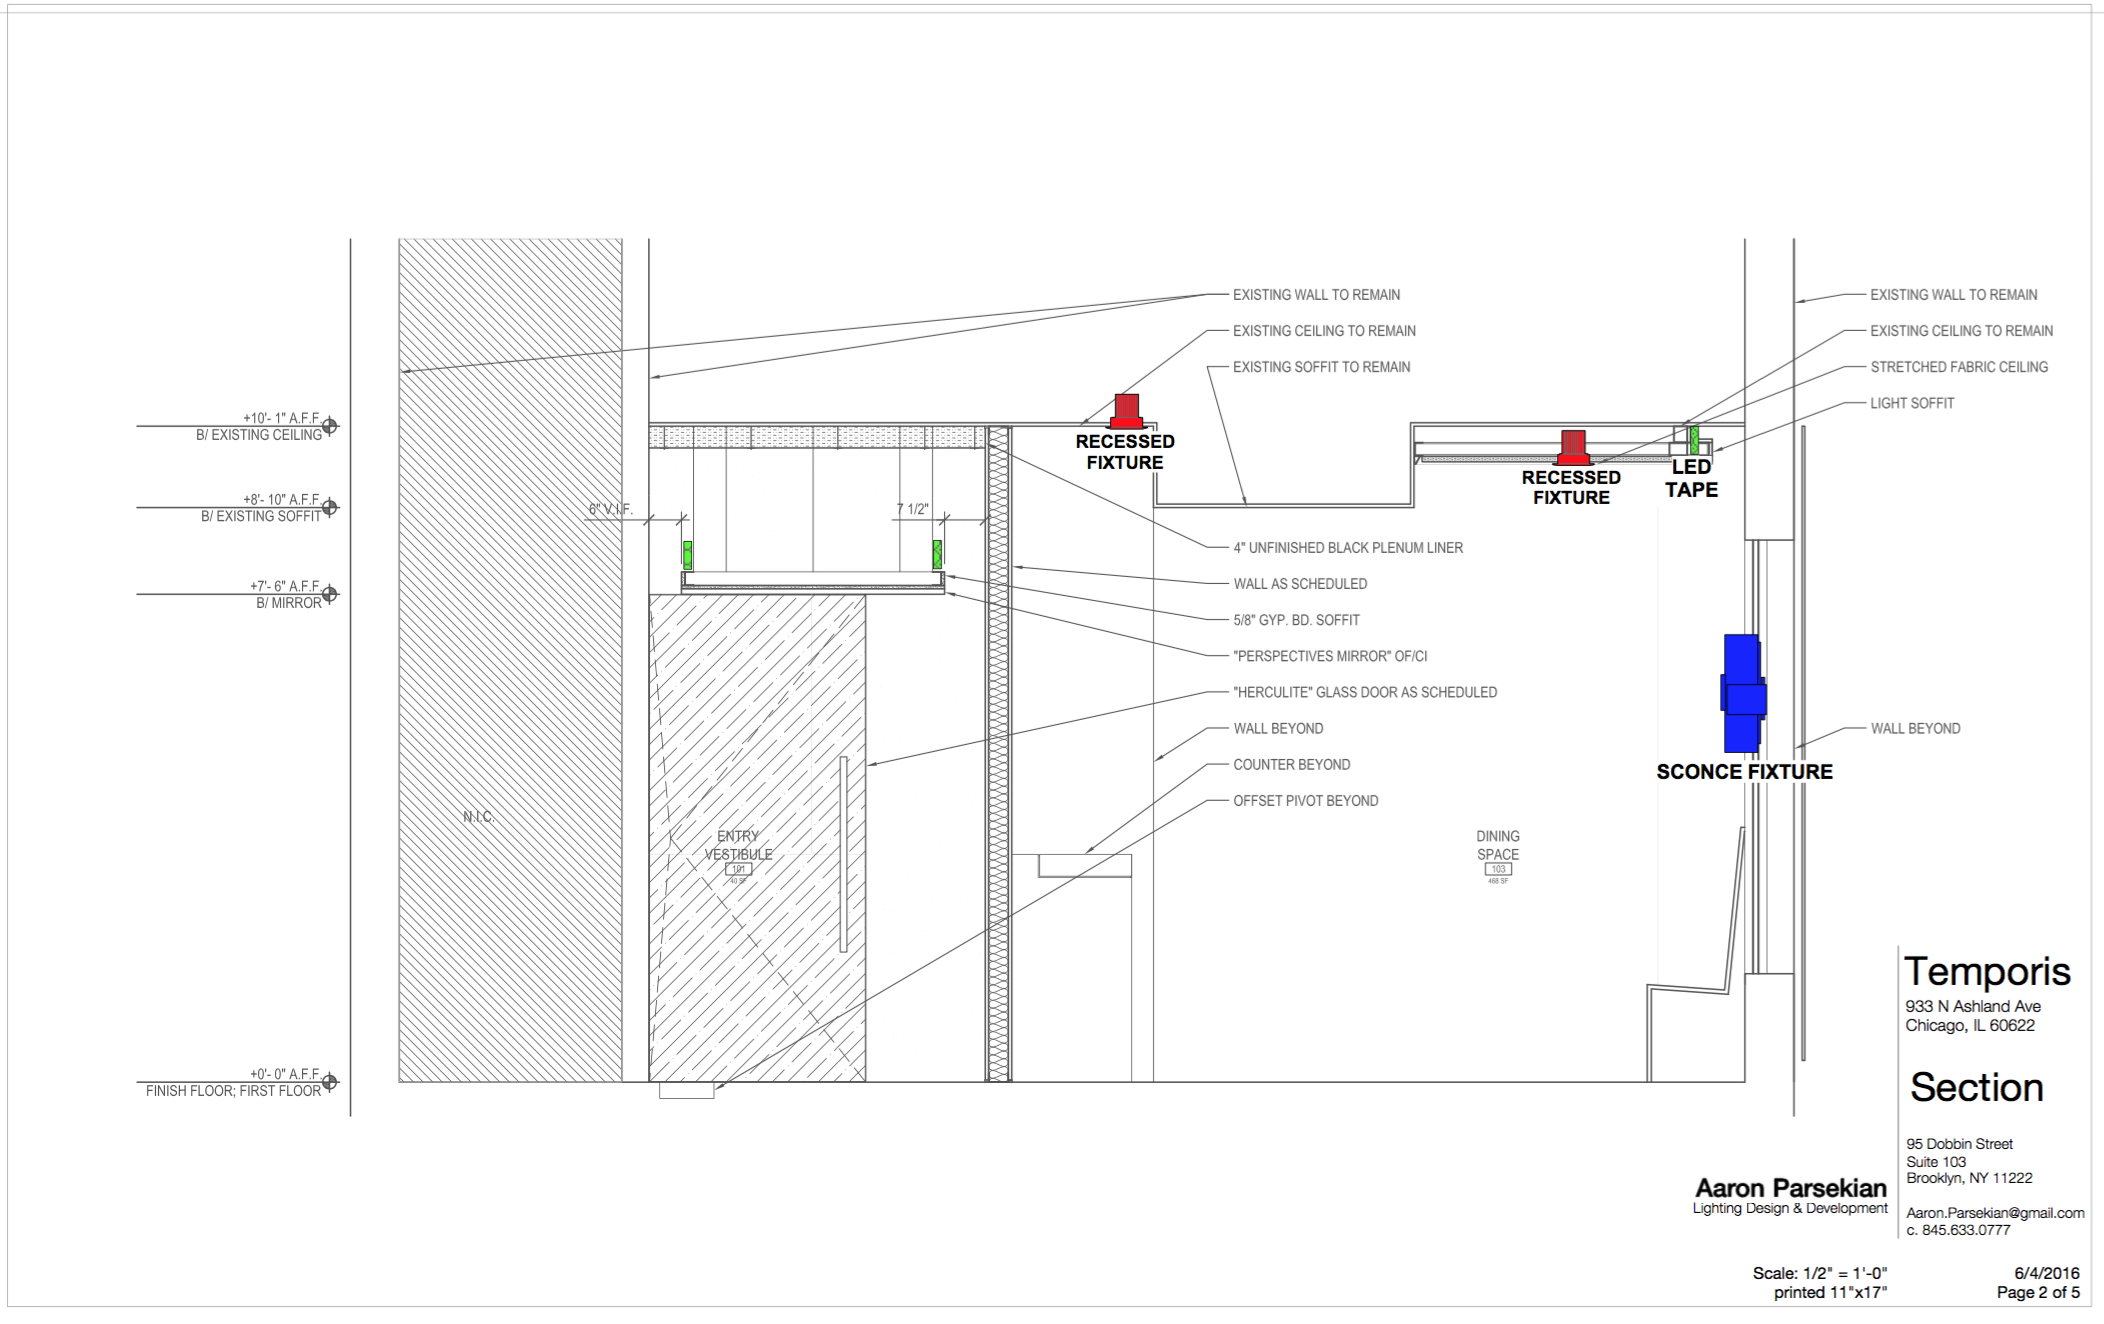
  • A section view
  • A channel hookup
  • A magic sheet

NOTE: This is a introductory guide. We will not be exploring the nuances of drafting, safe rigging and electrical practices, or fixture types. If you want to learn more please feel free to contact me.

A light plot is a plan view of the theatre showing where your lighting instruments will be placed. Most theatrical lighting instruments come with a pipe clamp attached to them so that they can be clamped anywhere along a steel pipe. Most theatres contain rows of these pipes installed specifically for hanging lights on, and each pipe is generally are referred to as an electric. Lights are then connected to electronic dimmers that are controlled with a lighting console via the DMX512 communication protocol.

Example Light Plot

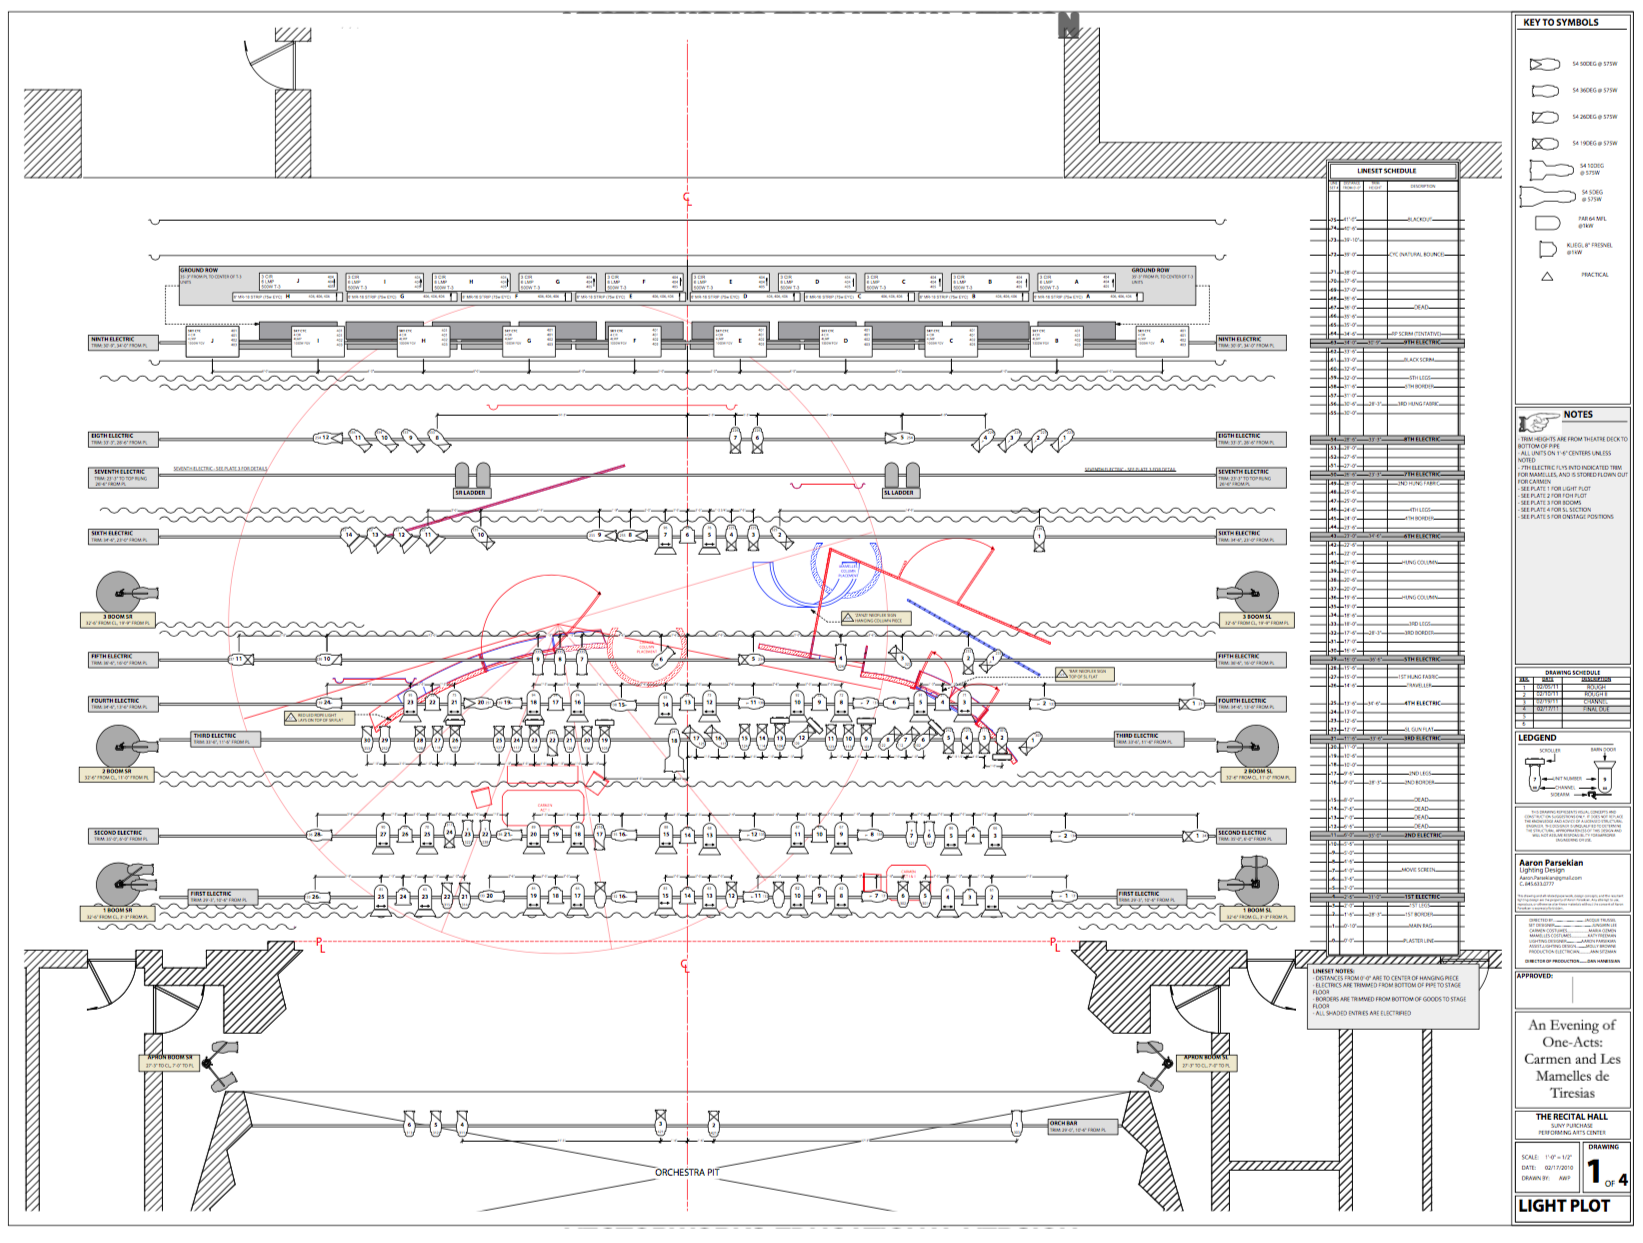
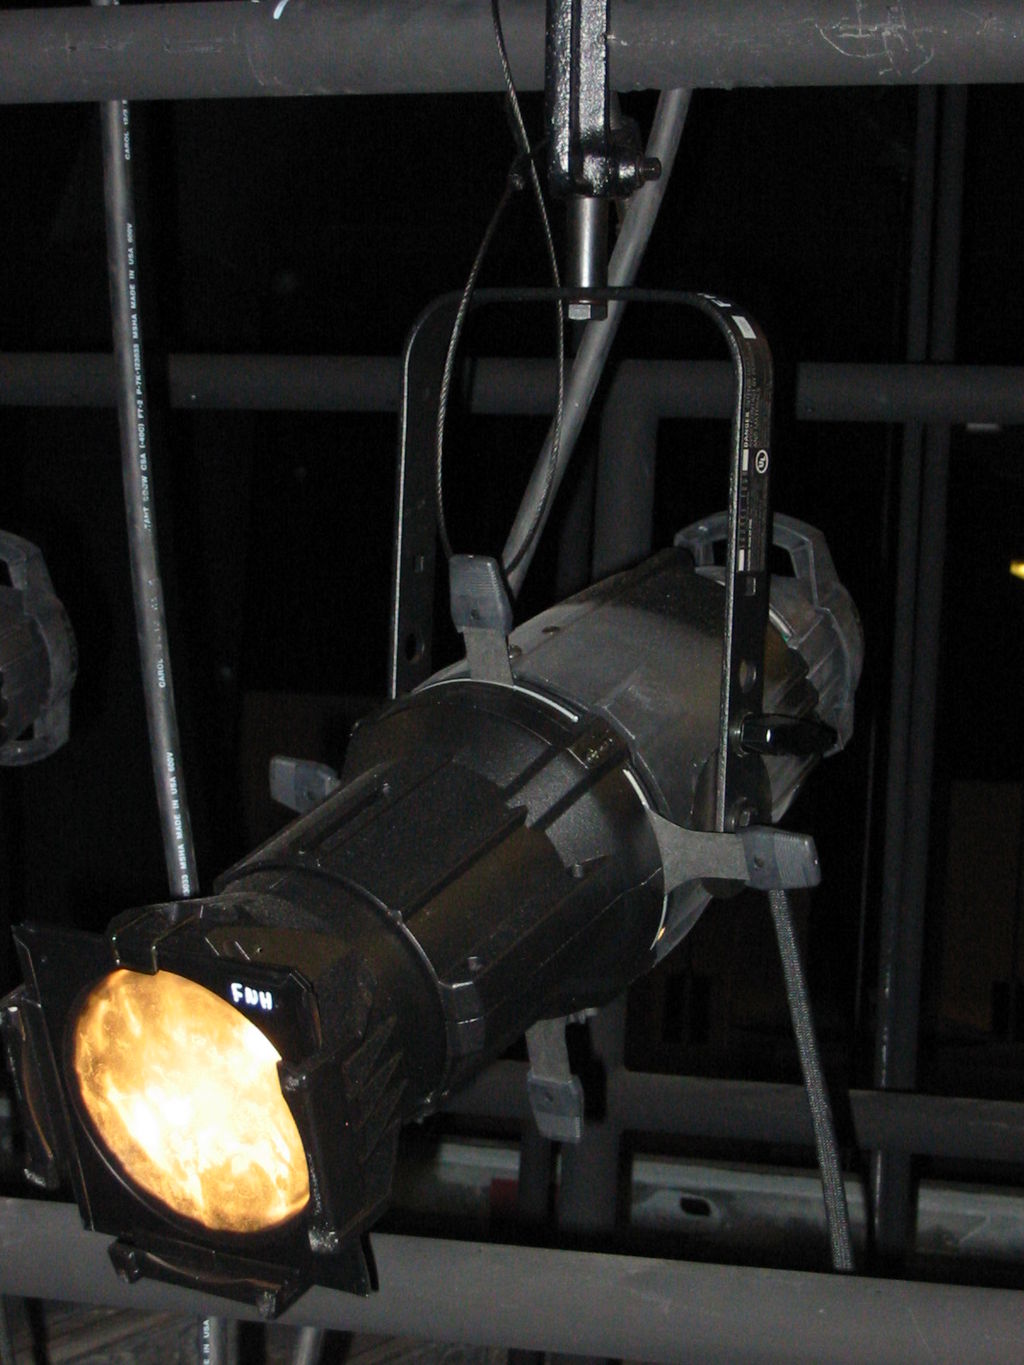
The light plot represents lighting instruments as schematic symbols. For instance these three instruments:

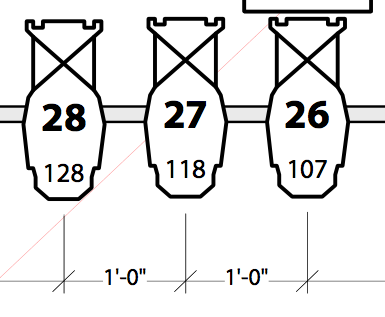
Are three ETC Source Fours with 19 degree lenses:

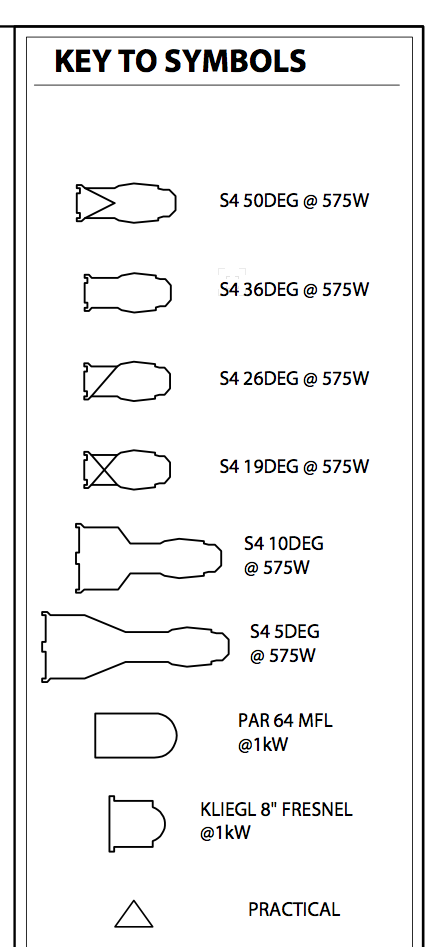
You can tell this by using the Key To Symbols, which is an important part of any light plot. The key to symbols defines every kind of light used in the lighting design:


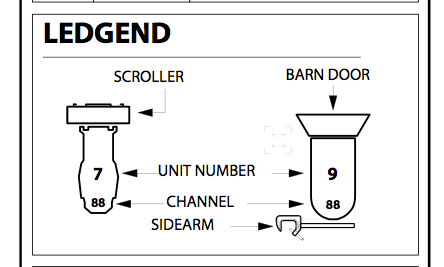
In addition to a Key to Symbols, a light plot should also have a Label Legend. The label legend explains how the light is circuited, any associated accessories, and if it needs to be hung on the pipe in any special way:

Looks like I couldn’t spell Legend correctly in undergrad! 🙁


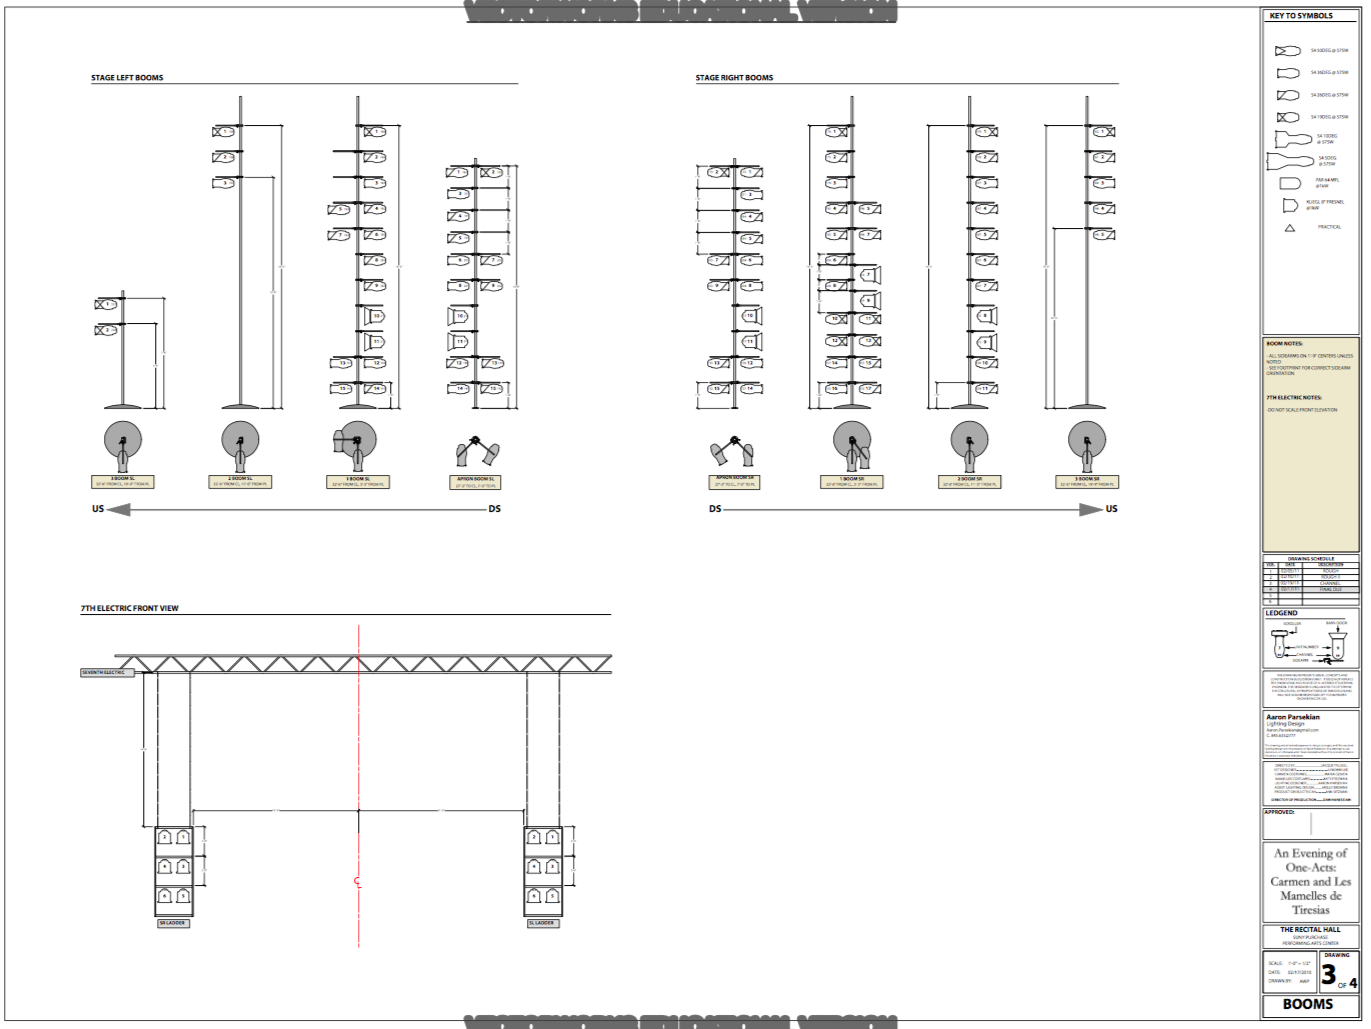
Sometimes lights are placed on vertical pipes called booms that extend up vertically from the floor. They’re probably called booms because of the noise they make if they were to fall over. If you don’t enough space on your light plot to draw them, they are generally represented by their footprint on the light plot and then drawn on a separate page as an elevation:


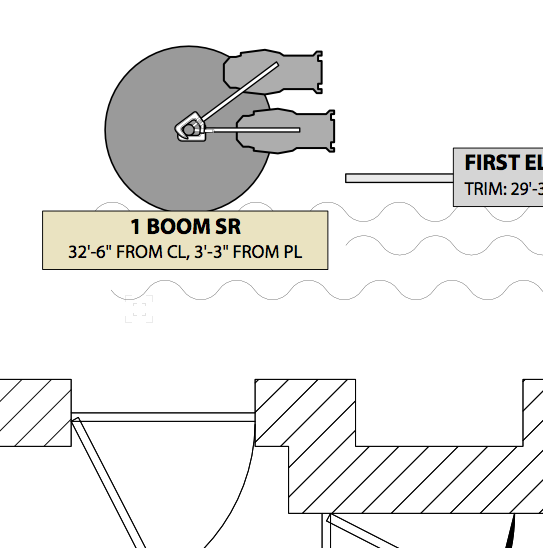
The first boom Stage Right is redrawn on another page as an elevation:


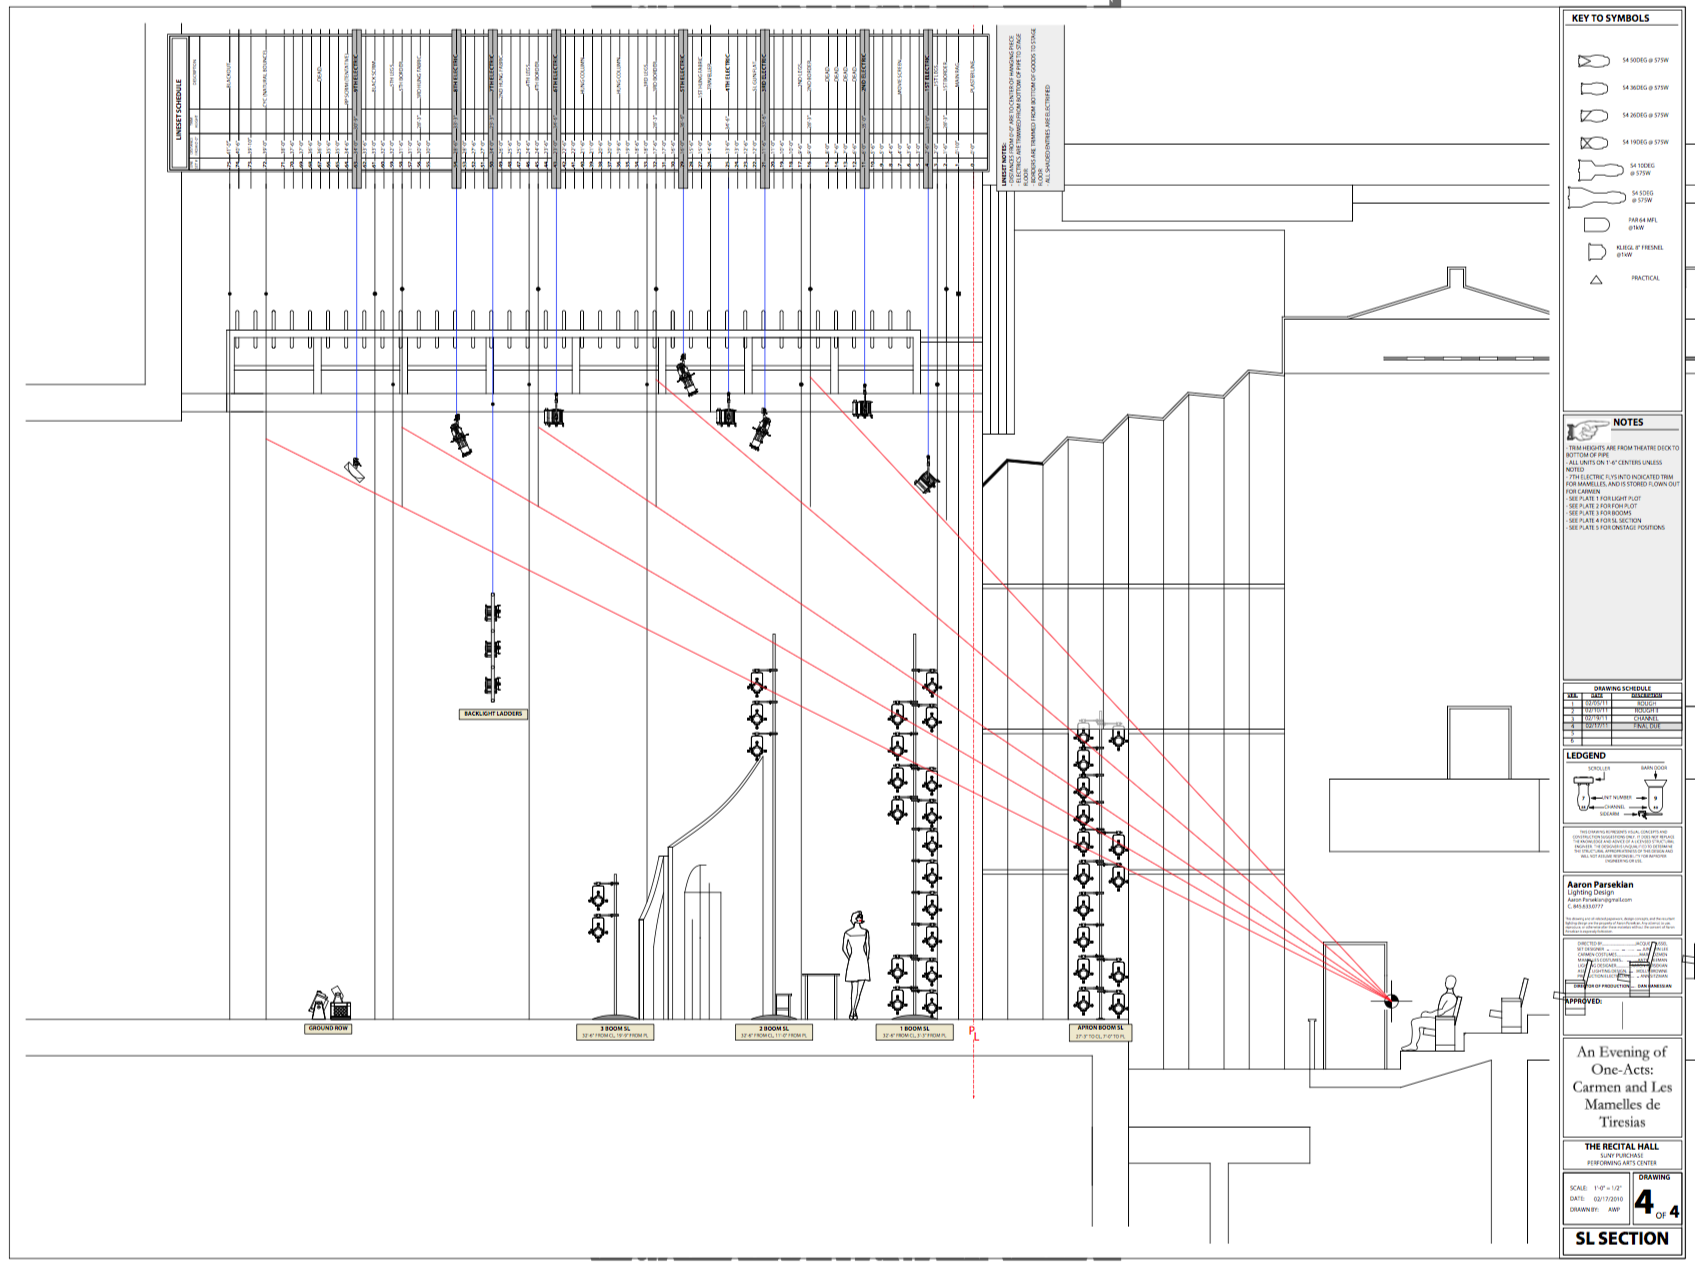
The Section View is a cross-section of the Theatre showing where the lighting instruments will be in elevation. Generally the section is “sliced” through the theatre on the centerline of the stage looking either to the left or to the right:

The Channel Hookup lists all of the lighting instruments, usually numerically by channel. Most lighting control consoles provide a second layer of organization after the DMX address called channels. These channels allow designers to group multiple DMX dimmers into a single channel, and to organize the light plot more coherently with the design goals. For example, you might place eight blue downlights in channels 11,12,13,14 even though they are plugged into DMX dimmers 18, 27, 34, 40. 

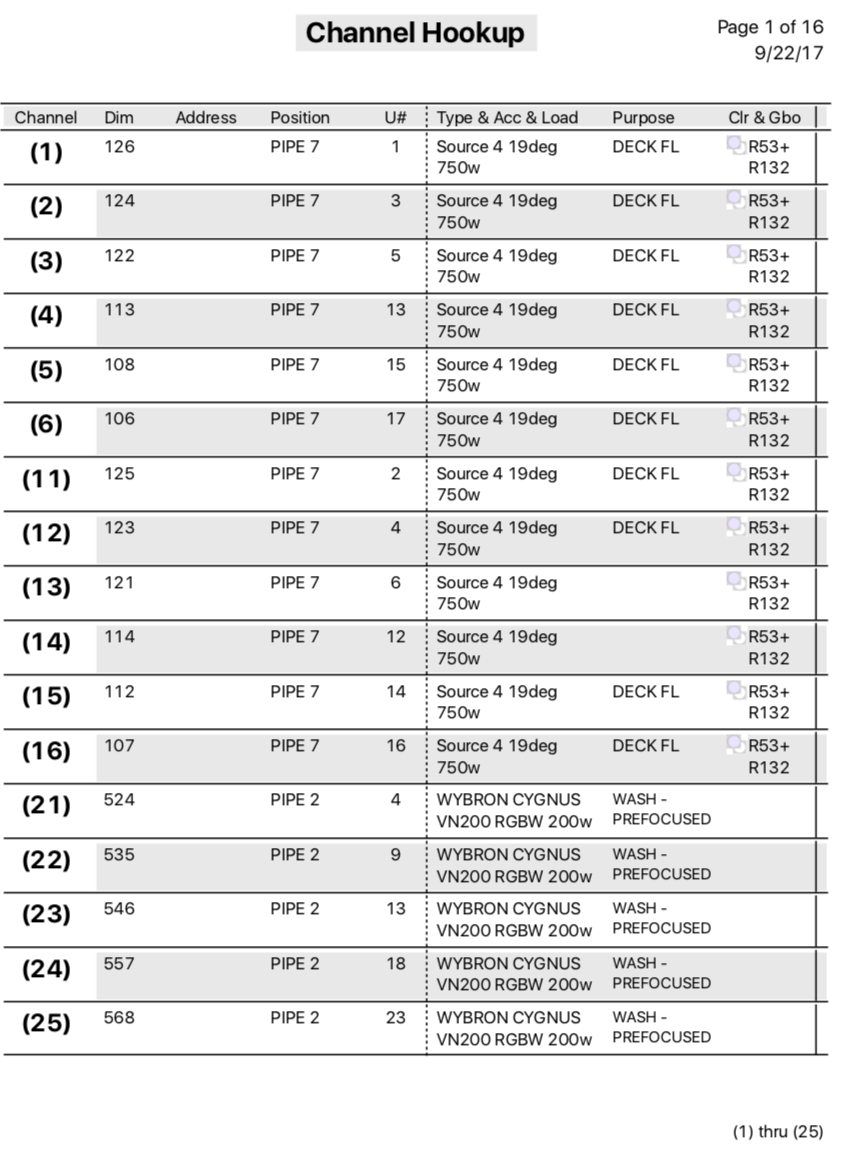
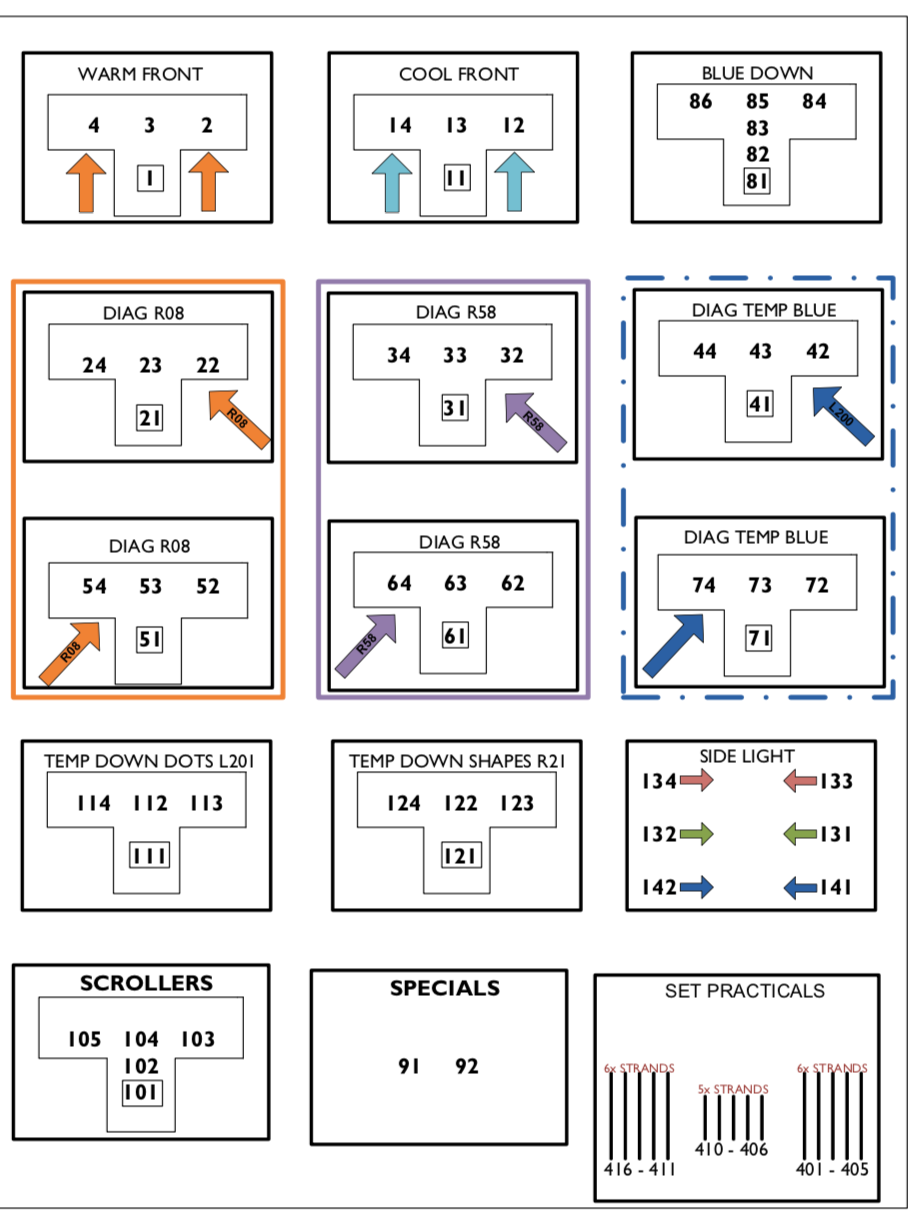
The Magic Sheet groups channels into design based groups. It serves as a shortcut to get lights on quickly. Instead of scanning an entire channel hookup or light plot to turn on all of the blue downlights, or to find a specific light pointed through a scenic window, the magic sheet is often the quickest guide to what lights are hung in the air

Front window sign

The architects initial rendering includes a small ‘TEMPORIS’ sign on the front window adjacent the front door:

screen-shot-2016-09-09-at-6-12-29-pm


The Temprois logo is made up of square blocks. These blocks are made up of different colors and shapes in some places, and there is some randomness to what block is what color or what shape between the venues website, menus, business cards. I decided the sign for the restaurants front window should be solid black and edge-lit with the ability to color change.

I originally chose 1/4 black acrylic for the face, but decided to go with P95 matte black acrylic for the final sign. The matte finish will look great against the glass window.

First step was vectorizing a drawing of the logo and sending it to the laser cutter. Luckily its a very simple design!

screen-shot-2016-09-09-at-7-00-30-pm

Always try things with cardboard first!

img_3326


The Sign is made up of black acrylic on top, an edge of milk acrylic in the middle, and another black acrylic cutout on the bottom.

img_3338

The first test looks nice! I am using 24V RGBWW LED tape. I chose this so I can use thinner wire coming out of the letters than 12V LED tape.

img_3336

The hard part with the 24V tape is that it can only be cut every 4 inches. I need to adapt it with some tiny soldering and cut it in the middle of these cut marks:

img_3357

In some places I fold the tape over itself to fit. I notch out parts of those places with a dremel drill press and an 1/8″ end mill bit:

img_3356

The whole assembly gets tested 100 times, then potted with 3M low heat hot glue to keep the weather out. I also add some silver foil tape to the back of the rear letter plate to help reflect some of the light to the edge:

img_3351

Everything gets clamped up for the night:

img_3709 img_3707 img_3696

So far so good!

img_3697

img_3722

Here is the final product cycling through some colors:

As an added bonus I cut the address out for above the doorway:

fullsizerender-48

Two happy co-chefs placing the sign for the first time:

img_4040

Temporis

My lighting Design for Temporis restaurant in Chicago, IL begins with sending a proposal to the architect to show him my design and technical intentions. I first received some initial renderings from the architect and talked with owner and co chef Sam Plonick about his culinary intentions. The menu will have seasonal adaptations throughout the year. The menu is a 10+ course tasting menu, fine dining. As the lighting designer for this style cuisine, showcasing the meticulous and intricate plating takes first priority. Helping create an exciting experience and environment is next on the list.

Architects first renderings:

image-88 image-84

image-89 image-90

Architects initial plans:

screen-shot-2016-09-09-at-5-40-54-pm


screen-shot-2016-09-09-at-5-41-05-pm

screen-shot-2016-09-09-at-5-41-14-pm


screen-shot-2016-09-09-at-5-41-22-pm


My proposal starts with a simple description of the design, a rough bill of materials, and some rough drawings :


screen-shot-2016-09-08-at-7-58-54-pm


screen-shot-2016-09-08-at-7-59-04-pm

screen-shot-2016-09-09-at-5-46-02-pm

screen-shot-2016-09-09-at-5-46-11-pm

screen-shot-2016-09-09-at-5-46-32-pm

Here is the first version riser diagram, which shows all of the lighting system components:

screen-shot-2016-09-09-at-5-46-21-pm


Color Composition

This week we explored color. We were asked to make a composition using color. I started out by taking the hue test:

Screen Shot 2015-10-08 at 10.41.53 PM

I wonder if I would do any better with my calibrated monitor at home?

Next I decided I wanted to do some physical control to manipulate the hue, saturation, and brightness of my ‘composition’  – since it would be very related to how I want to use my programming knowledge as a lighting designer.

I started out by trying to use some addressable LED tape that I had. This turned very frustrating very quickly. The library used to control this tape is no cake-walk, and I found myself in over my head after two days of messing with it.

I turned to a slightly simpler route and used p5 and an arduino to change the H/S/B of some squares on screen via a slider and two knobs.

IMG_1081


Here are some of the outputs:

ss3


ss2


ss1

And a video:

Working with serial

This week we started working with the Arduino and serial.

Here I have two potentiometers and a push button:

FullSizeRender 3

Using one sensor, I uploaded the example code to display the sensor value in different ways:


Screen Shot 2015-10-13 at 2.49.27 PM

We learned how to write to three sensors and view the data in the serial monitor:

Screen Shot 2015-10-13 at 2.53.15 PM

Next we learned how to use the arduino to send values from an analog sensor via serial to the p5 IDE.

My favorite friend the sliding 10K pot:

FullSizeRender

The arduino code to write the single sensor value in binary to serial is pretty simple:

Screen Shot 2015-10-13 at 2.14.18 PM

Here is the p5 sketch working with it. It is printing the serial value as text:

Screen Shot 2015-10-13 at 2.01.50 PM

Next I mapped this data into a graph:

Screen Shot 2015-10-13 at 2.06.08 PM


It was really exciting to get the two potentiometers and the push button to talk to p5 at the same time via serial:

Screen Shot 2015-10-13 at 4.57.55 PM